The project
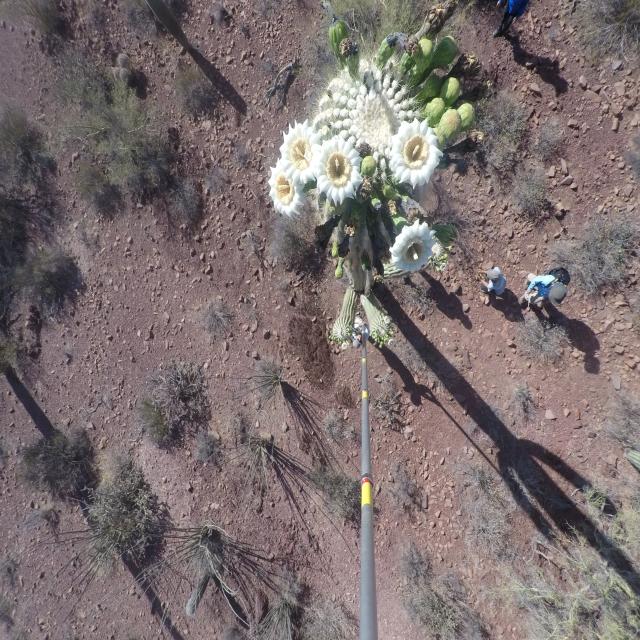
The saguaro cactus (Carnegiea gigantea) is a keystone of the Sonoran Desert ecosystem, and the way it buds, flowers, and fruits each spring is one of the clearest signals biologists have for tracking how the region is responding to a warming climate. For seven reproductive seasons, biologists at Saguaro National Park photographed the crowns of the same 55 cacti almost every morning — but the resulting archive of roughly 63,000 images had to be counted by hand, which is the bottleneck I set out to break.
I led a small team to hand-label thousands of those photos and trained a YOLO-family object detector to recognize four phenological stages: bud, flower, green fruit, and red fruit. The final model labels the entire archive automatically, producing a daily, individual-level dataset of saguaro phenology spanning seven years — fine-grained enough to support climate-impact analysis that wasn't tractable before.
Training the model
After comparing two-stage detectors and several YOLO variants, I settled on a fine-tuned YOLOv8-Large. The choice was driven by an empirical constraint: the original photographs are 4000×3000, and at the standard 640×640 input size the model lost the small visual details that separate a bud from a young green fruit. Larger inputs (1707×1280) preserved that detail but blew up memory usage, ruling out the heavier two-stage detectors. YOLOv8-Large hit the sweet spot — large enough to be accurate, small enough to train at a reasonable batch size on the hardware available.
Earlier iterations of the project (built during a deep learning class) used YOLOv5 and a much smaller labeled set. After the class, I expanded the annotation pass, retrained on the larger corpus, and pushed accuracy substantially higher.
Model performs strongest on flowers (the most visually distinct class) and weakest on red fruit — the same class human labelers also struggled with most.
What the model revealed
Once the model was trained, I ran it across the full archive — roughly 63,000 photos across 23 individual saguaros and seven years. That produced a per-day, per-cactus record of bud, flower, and fruit counts dense enough to ask questions that manual counting couldn't reach. Two patterns stood out.
The model recovered the textbook phenological cascade. Averaging across cacti and years, buds peak in early-to-mid May, flowers follow a couple of weeks later, green fruit takes over in early June, and red ripe fruit closes out the season in late June and early July — a clean wave of overlapping stages that's hard to see in any single photo but emerges immediately in aggregate.
The dataset also caught a dramatic two-year climate swing. 2022 was an exceptionally poor year across every phenological stage — total reproductive output per cactus collapsed to roughly a fifth of the 2017–2021 average. The following year more than compensated: 2023 produced more buds, flowers, and fruit than any prior year in the record. The kind of swing that biologists have hypothesized as a saguaro response to monsoon variability shows up vividly once the dataset is dense enough to draw the curves.
The pattern isn't an artifact of one or two cacti — it holds across all four phenological classes individually.
Infrastructure & team
Beyond the model itself, getting from raw images to a usable dataset took a real pipeline. I built the annotation workflow (CVAT and Roboflow), wrote the preprocessing and inference scripts, organized the multi-year image archive, and recruited and led a small team of annotators — defining the label schema, writing the labeling guide, and reviewing their work to keep ground truth consistent across thousands of boxes. The infrastructure was designed so that adding new seasons or new classes (e.g. saguaro arms) is a matter of additional labels rather than rebuilding the system.
More examples
A handful of held-out test images with ground-truth annotations overlaid.